Demographics Summary
In This SectionThe 2025 data presented here builds on the analysis from the League’s report, Racial/Ethnic and Gender Diversity in the Orchestra Field 2023. Definitions, technical notes, and details on sample size and representativeness can be found in that report.
Youth orchestra data is included only in analyses of top executives, music directors, and conductors.
While this report provides a national perspective, each orchestra contributes its own unique story to the broader narrative.
Why does the League track orchestra demographics? How was this data analyzed? What steps are orchestras taking to improve diversity of representation? Visit our Frequently Asked Questions.
Musician Diversity
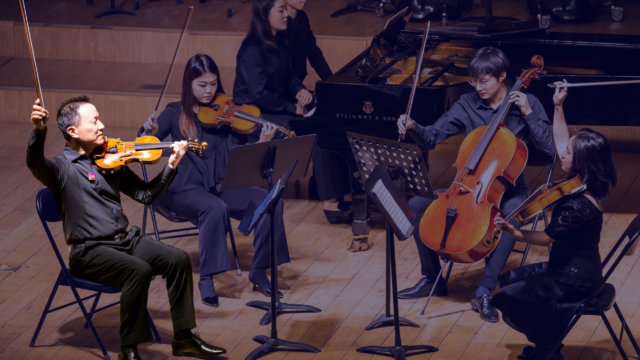
From 2015 to 2025, there was little progress in increasing the very low representation of Black musicians and only modest gains for other communities of color.
In 2025, the racial and ethnic composition of surveyed orchestra musicians remained predominantly white (75.8%), with 2.1% identifying as Black, 4.1% as Hispanic, 11.6% as Asian, 2.3% as multiracial, 0.2% as American Indian, and 0.7% as Native Hawaiian.
In 2025, women and non-binary individuals comprised almost half of the orchestra musician population. However, their representation remained lower within larger budget orchestras, than in smaller and medium budget orchestras.
Visit our Musician Diversity page for graphs, charts, and more detailed data.
Conductor Diversity
Racial and ethnic diversity improved significantly during the period 2015-2025 across all racial and ethnic groups. By 2025 almost one third of orchestra conductors were people of color, nearing comparison with the U.S. population overall.
The representation of women and non-binary individuals also grew during this period, reaching 29.4% by 2025.
Visit our Conductor Diversity page for graphs, charts, and more detailed data.
Music Director Diversity
In 2025, 85.8% of music directors were male—despite an increase in the representation of women in these roles over the previous decade. That same year, 72.4% of music directors were white, with only minor fluctuations taking place in the representation of most communities of color during the same period.
Visit our Music Director Diversity page for graphs, charts, and more detailed data.
Staff Diversity
After a decade of moderate growth—and a notable increase in Black representation during the pandemic years—people of color made up 25.5% of the orchestra staff workforce in 2025.
As in other performing arts sectors, women consistently outnumbered men throughout the decade, while reported non-binary representation rose significantly from a low starting point.
Further research is needed to explore how race, gender, and power intersect—and how they shape who holds power within orchestra hierarchies.
Visit our Staff Diversity page for graphs, charts, and more detailed data.
Top Executive Diversity
In 2025, white individuals occupied 87.8% of top executive positions, despite the representation of people of color more than doubling since 2015.
Visit our Top Executive Diversity page for graphs, charts, and more detailed data.
Board Diversity
In 2025, white individuals held 81.9% of orchestra board positions, despite the representation of people of color doubling since 2015.
Gender parity was maintained throughout the decade, but women and non-binary individuals were more prevalent in small to mid-sized organizations than in larger-budget orchestras.
Visit our Board Diversity page for graphs, charts, and more detailed data.
Become a member
Thank you for your interest in the League of American Orchestras! We are dedicated to advancing the orchestral experience for all.
Join Now