Conductor Diversity
In This SectionFrom 2015 to 2025, both racial/ethnic and gender diversity among conductors saw significant improvement, with notable progress across all racial and ethnic groups.
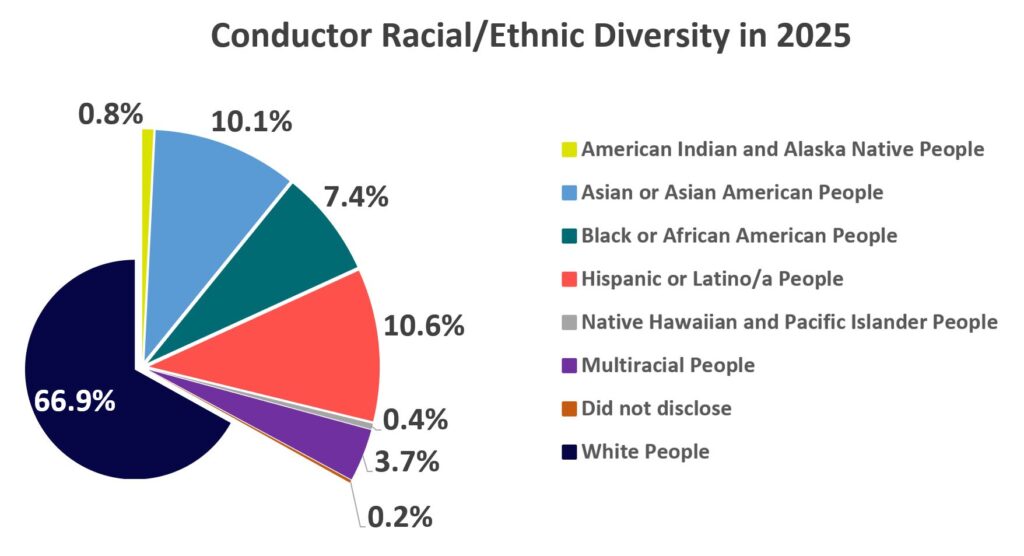
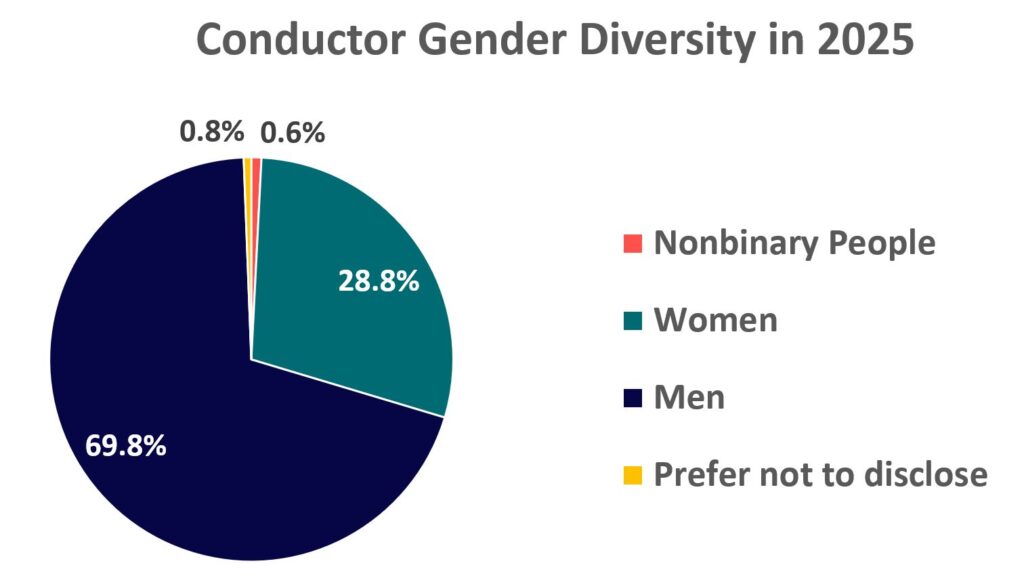
By 2025, 32.9% of conductors were people of color, bringing their representation closer to that of the overall U.S. population. Meanwhile, women and non-binary individuals accounted for 29.4% of all conductors.
This data includes assistant conductors, music directors, and youth orchestra conductors.
2025 Snapshot
Why does the League track orchestra demographics? How was this data analyzed? What steps are orchestras taking to improve diversity of representation? Visit our Frequently Asked Questions.
2015-2025 Trends
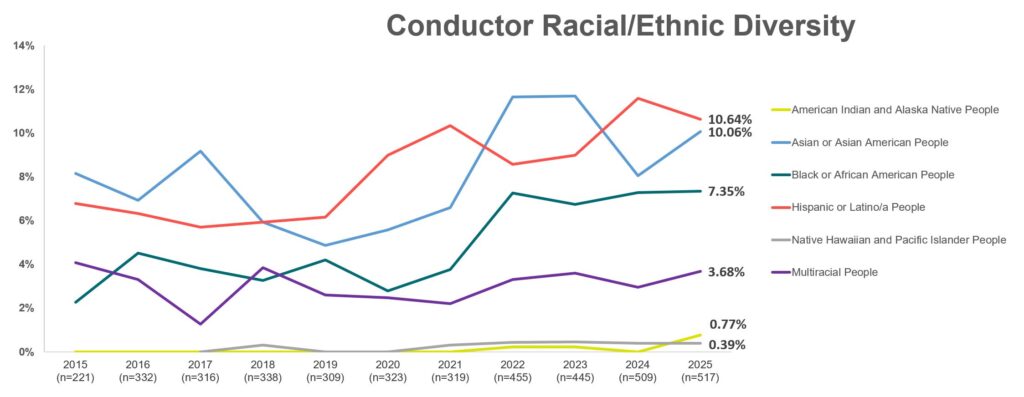
Between 2015 and 2025, overall representation of people of color increased significantly, reaching 32.9%. The pandemic years, in particular, saw significant growth across all racial and ethnic groups.
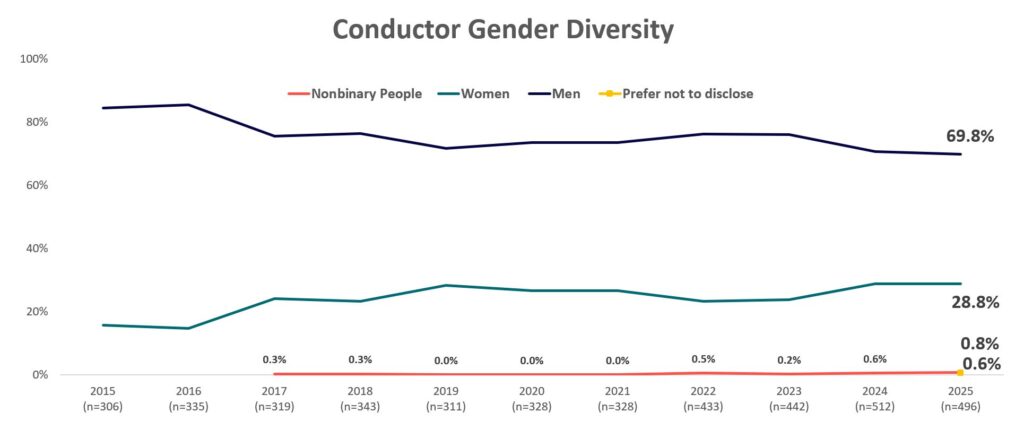
Women’s representation grew from 15.7% to 28.8% by 2025, marking a shift toward greater gender diversity in conducting roles.
Why does the League track orchestra demographics? How was this data analyzed? What steps are orchestras taking to improve diversity of representation? Visit our Frequently Asked Questions.
More Resources
The following programs are working to increase the gender diversity of conductors in American orchestras.
Become a member
Thank you for your interest in the League of American Orchestras! We are dedicated to advancing the orchestral experience for all.
Join Now